

Biden and Trump, though old, are both likely to survive to the end of the next president’s term, demographers explain
- Written by Dudley L. Poston Jr., Professor of Sociology, Texas A&M University

In a recent poll[1], 67% of Americans surveyed believe that President Joe Biden, 81, is too old to serve another term as president. But only 41% of respondents said they feel that way about former President Donald Trump, who is 77. Both men have stumbled around and have forgotten or mixed up names and events, which are behaviors that characterize some older people[2].
We are demographers[3] – not scholars of brain function[4] considering people’s cognitive abilities. But there is a question we can answer, one that speaks to concerns about both men’s ages: their life expectancy.
And it turns out that the four-year age difference between Biden and Trump isn’t really much of a difference when it comes to their respective odds of surviving. The statistical odds are good that both would complete a four-year term as president.
We know this because of one of the most versatile tools of demography[5], which is called a life table. It’s a table of age groups, usually from 0 to 100 years, showing the percentages of the population at any age[6] surviving to a later age. It is based on the age-specific death rates of the population.
Early record-keeping
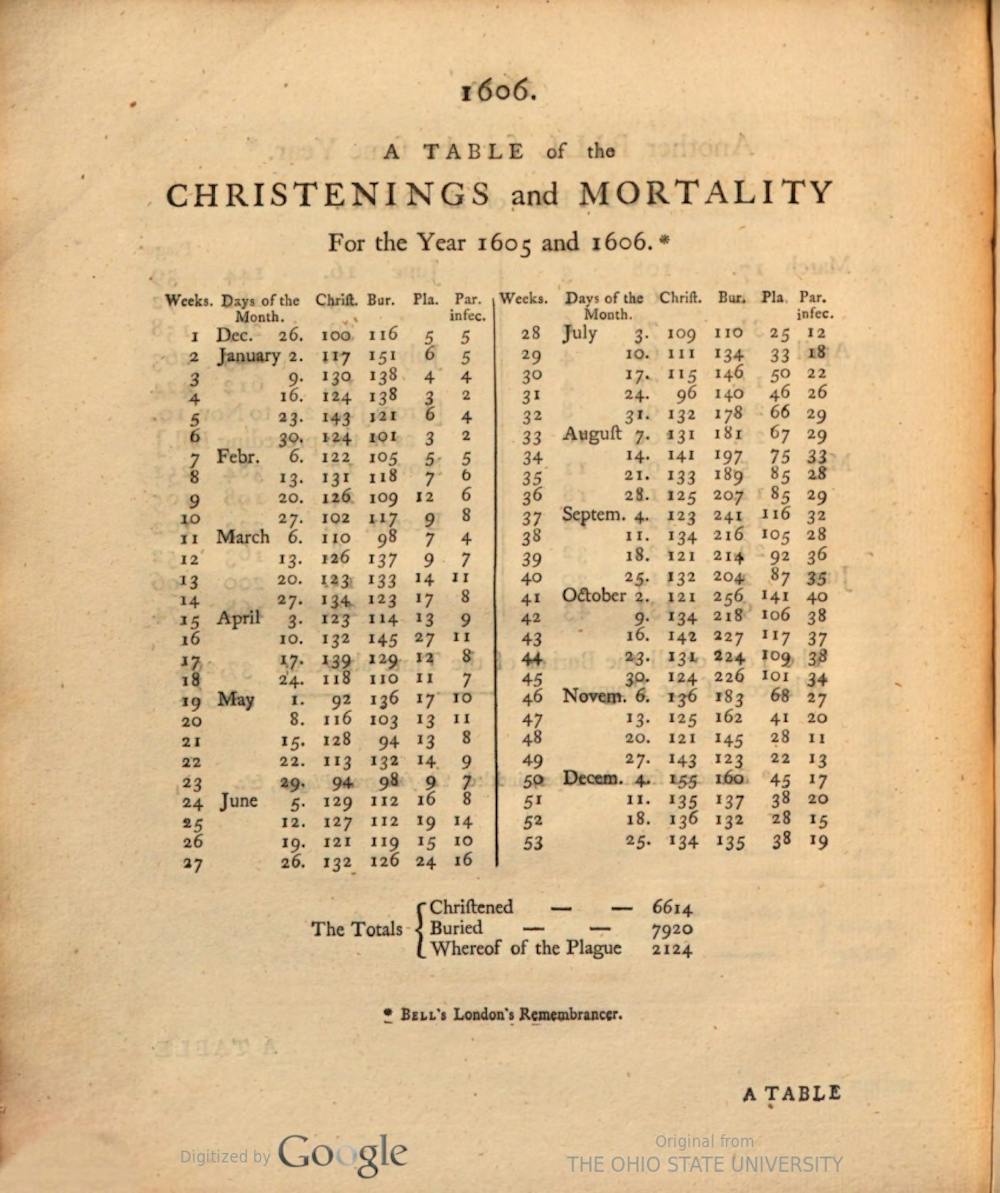
The life table dates back to John Graunt, a self-educated citizen of London[8] in the 17th century who is known by many as the founder of demography[9]. In 1662, Graunt produced and distributed the first life table[10], showing the probabilities of London’s population surviving from one age to the next.
There are two kinds of life tables. The first is a cohort life table, which represents the death rates and ages for a specific group of people. A cohort table could, for example, document the deaths of all males born in the U.S. in 1940. That table would be very precise, but it wouldn’t be complete until every member of the group had died – so it’s not especially useful for examining the prospects of the living.
As a result, demographers more often use life tables for a current time period, such as the year 2021, which is the date of the most current period life table for the U.S.[11]
It shows the probabilities of surviving from one age to another age based on the death rates in 2021.
Statistical documentation
A period life table for 2021[12] indicates that almost 99% of all people born in the U.S. survive from age 0 to age 20; just over 95% of them survive to age 40, and over 85% to age 60. More than 51% of them live to age 80.
But life tables get much more specific. It’s important to examine life tables’ data for each age, race and gender combination. This is because males don’t live as long as females, Black people don’t live as long as white people, and non-Hispanic people don’t live as long as Hispanic people. There are more specialized life tables that focus on education level and income, but they are not as current and complete as the broader tables.
Biden and Trump are both non-Hispanic white men. Biden is 81 and Trump is 77.
Based on the age-specific death rates of non-Hispanic white men in the U.S. in 2021, Biden has a 92.9% probability of surviving at least to age 82. Trump has a 95.1% probability of surviving to at least age 78. These odds are nearly identical, so each man is very likely to be alive on Inauguration Day 2025, regardless of which of them is being sworn in as president.
What about finishing out that four-year term? Our calculations from the life tables[13] reveal that there is a 63.3% probability that Biden will survive another five years – to at least 86. And there is a 73.6% probability for Trump to survive that period – to at least age 82. Of course, it’s possible either or both will die, but their odds of death are much lower than their odds of survival.
In general, the chances are a bit more favorable for Trump, because he is slightly younger.
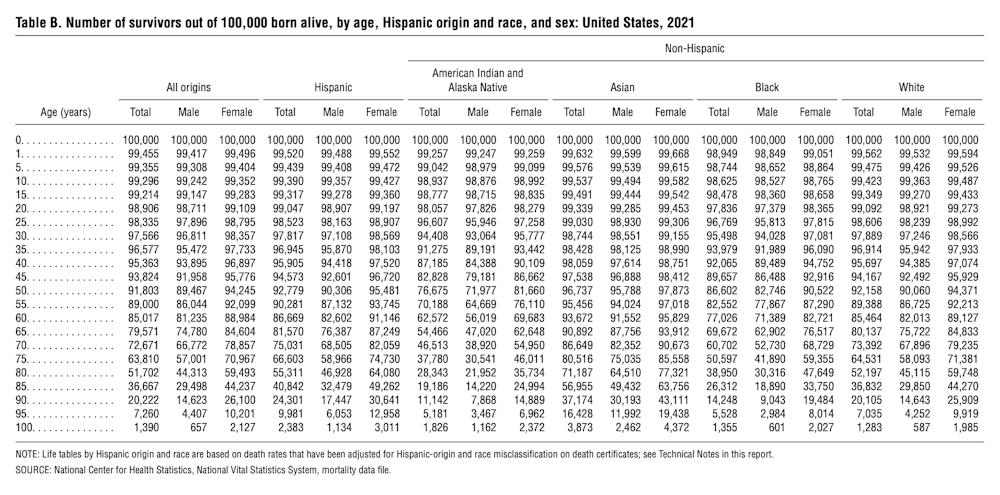 The 2021 life table for the U.S. is the most recent available.
U.S. Centers for Disease Control and Prevention, CC BY-ND[14][15]
The 2021 life table for the U.S. is the most recent available.
U.S. Centers for Disease Control and Prevention, CC BY-ND[14][15]
Precise calculations
There are two factors that let us demographers get even more specific.
First, we measure age as exact years. Their age gap is not four years, but 3.5: Biden was born on Nov. 20, 1942[16], and Trump on June 14, 1946[17]. That 10 percentage-point survival advantage for Trump over Biden was based on a four-year age difference. The real difference drops one or two points because they’re not quite so far apart in age.
Second, demographers have shown that people who attend church regularly live longer[18] than those who don’t. This is not because of some divine favor but because churchgoers tend to have more optimistic attitudes, clearer senses of purpose and more regular social interactions and connections. All of these factors extend people’s lives. Biden is a Catholic and attends Mass weekly, in general[19]. Trump was raised as a Presbyterian but now considers himself to be a “nondenominational Christian[20],” and he attends religious services very irregularly. So, Biden gets the survival advantage associated with churchgoing.
Other factors come into play with longevity as well, such as marital status, body mass index scores[21], diets and levels of physical fitness and exercise.
A comparison with the American people
Biden and Trump are two of the three oldest people[22] ever to serve as president. The population they are seeking to lead is also older than ever before.
The median age of the nation’s population was 38.9 in 2022[23] compared with 28.1 in 1970[24] and just 16.7 in 1820[25].
“Relative to the age of the population[26], President Biden is no older than the country’s first presidents,” including Thomas Jefferson, wrote James Chappel, a scholar of aging and history at Duke University, in The New York Times. More recently, Reagan was older than the median American of his time than Biden and Trump are today.
At their second inaugurations, Jefferson was roughly 45 years older than the median age of the U.S. population then, and Reagan 43 years older. If Biden wins a second term, he will be 42 years older than today’s median. If Trump wins in 2024, he will be 38 years older than the current median.
As demographers, we can say it is likely that both Biden and Trump will be alive when the presidential term that begins in 2025 comes to an end in 2029. But as the U.S. population gets older too, the age factor may become less important to voters. This is not an immediate change, however, but one that will likely occur over the next decade or so.
References
- ^ In a recent poll (poll.qu.edu)
- ^ which are behaviors that characterize some older people (www.nia.nih.gov)
- ^ demographers (scholar.google.com)
- ^ scholars of brain function (www.salon.com)
- ^ tools of demography (www.cambridge.org)
- ^ percentages of the population at any age (www.cdc.gov)
- ^ Wikimedia Commons (en.wikipedia.org)
- ^ John Graunt, a self-educated citizen of London (www.britannica.com)
- ^ founder of demography (www.cambridge.org)
- ^ In 1662, Graunt produced and distributed the first life table (www.jstor.org)
- ^ current period life table for the U.S. (www.cdc.gov)
- ^ A period life table for 2021 (www.cdc.gov)
- ^ Our calculations from the life tables (www.cdc.gov)
- ^ U.S. Centers for Disease Control and Prevention (www.cdc.gov)
- ^ CC BY-ND (creativecommons.org)
- ^ Biden was born on Nov. 20, 1942 (www.whitehousehistory.org)
- ^ Trump on June 14, 1946 (www.whitehousehistory.org)
- ^ people who attend church regularly live longer (doi.org)
- ^ attends Mass weekly, in general (www.reuters.com)
- ^ nondenominational Christian (www.deseret.com)
- ^ body mass index scores (doi.org)
- ^ two of the three oldest people (theconversation.com)
- ^ 38.9 in 2022 (www.census.gov)
- ^ 28.1 in 1970 (www.census.gov)
- ^ 16.7 in 1820 (www2.census.gov)
- ^ Relative to the age of the population (www.nytimes.com)
Authors: Dudley L. Poston Jr., Professor of Sociology, Texas A&M University